In this article, we'll explain how to read your analytics dashboard
The analytics board is the best place to track how many invites you are sending and how your customers interact with their invitations.
Filtering your Analytics
To start, head to the filter tabs on the top right to ensure you're looking at the timeline you're most interested in. For example, you can show Analytics for this week or this month. Or you could show the Analytics for SMS or email or both.
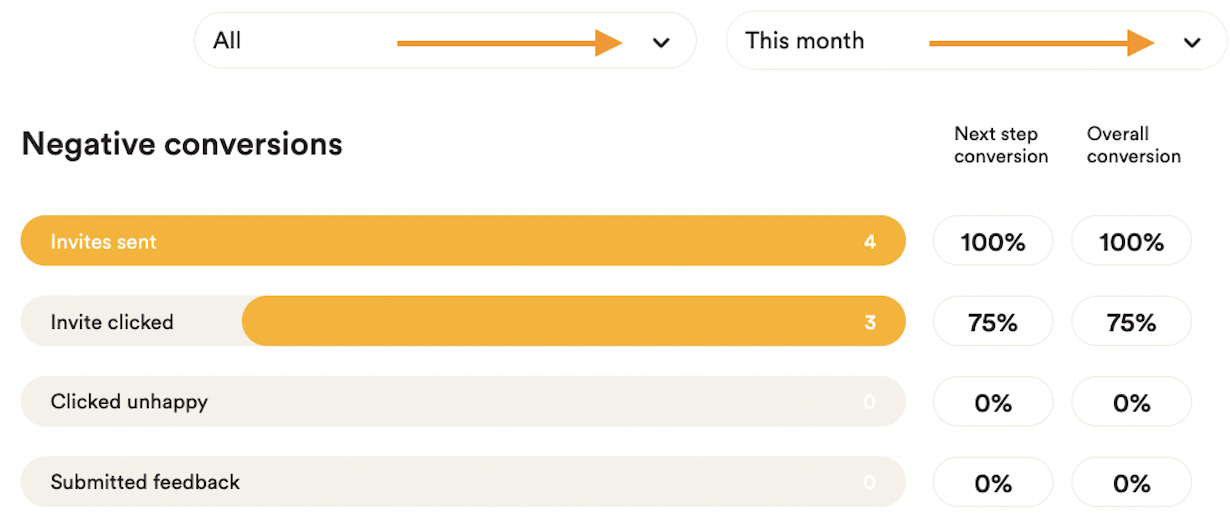
Positive and Negative Conversion Bars
The positive and negative conversations bars show the total invitations sent in the first bar.
In the "Invites clicked" bar, you will see how many invitations have been opened.
The third bar will show you how many of the invitees "Clicked happy" or "Clicked unhappy".
"Clicked review site" and "Submitted feedback" bars show the total number of invitees that clicked to leave feedback on your chosen platform or feedback form.
Note that in some instances, your customer may have clicked the review site but not left a review.
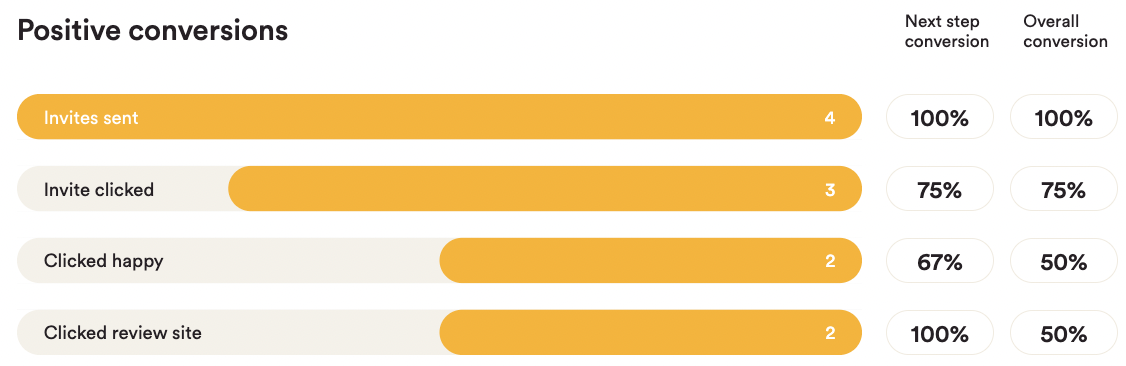
Next Step Conversion Percentages
On the right of the conversion bars, you will see "Next step conversion". This shows the percentage of the group above that continued onto the next step.
The example above shows that 75% (or 3 out of 4 invitees) clicked the invitation.
2 out of 3 invitees (or 67%) clicked to indicate they were happy with the service they received.
Both customers who clicked happy have also clicked the review site, so the final Next step conversion rate is 100% (or 2 out of 2).
Overall Conversion Percentages
On the right of the conversion bars, you will see "Overall conversion". The overall conversion rate will show the percentage of the total invitees that completed this step of the process.
In the example above, you can see that 75% (or 3 out of 4 invitees) clicked the invitation.
2 out of 4 invitees (or 50%) clicked to indicate they were happy with the service they received.
Both of the customers that clicked happy have also clicked the review site, so the final Next step conversion rate is also 50% (or 2 out of 4).
Retargeting Conversion Bars
If a customer indicated they were happy, but hasn't clicked on Google or Facebook within 24 hours, betterbunch identifies them as a promoter of your business - yay! After 1 day, we will send them a cheeky reminder email with the intention of catching them at a better time.
You can learn more about promotor retargeting here.
If Promotor Retargeting is turned on for your business, the "invites sent" bar will show how many promotor retargeting invitations have been sent out.
The "clicked review site" bar will show how many of the promotor retargeting invitees have clicked to leave feedback on your chosen platform or feedback form.
Note that in some instances, your customer may have clicked the review site but not left a review.
If you need help understanding your analytics or would like advice on improving your interaction rates using your analytics data, reach out to our Customer Care team here.
We're always happy to help!